Happy Monday with Dean and Crystal…
Hey, there… Welcome back to another Happy Monday…
…where we get to look at what happened to the real estate market over the previous week, and I throw in a few tidbits that I think are interesting…and otherwise miscellaneous items that may or may not be associated with the behavior of the national and local real estate markets…
With your permission… let me entertain you for a bit…
- Super Bowl LVI, from the NFL to NBC:
Peacock, on the clock…This year NBC has Bowl broadcast rights and has already sold out of Bowl ads, with some 30-second spots selling for a record $7M. Car and tech companies are among the biggest spenders, while crypto companies are expected to advertise for the first time.
- Apparently, the hot new thing among transportation agencies is to have people vote on punny names for their snowplow fleets.
Scotland’sbeen doing it since 2006 with tremendous results (Buzz Iceclear, Lord Coldemort, Creedence Clear-Road Revival, and last week Minnesota’s DOT announced the winners of its own Name-A-Snowplow contest:
Betty Whiteout was the runaway winner, followed by Ctrl Salt Delete and The Big Leplowski.
Our entry for next year: Snow More Mr. Ice Guy
- This Day in History-February 7, 1964-The Beatles arrived in New York, 6 days after they scored their first No. 1 US hit with “I Want to Hold Your Hand.”
OK, enough fun and games…let’s look at the National Real Estate behavior for last week:
The Headline hasn’t changed…Sellers across the country remain confident amid rising interest rates…but, do buyers really care?
Homes keep selling fast and the housing inventory keeps falling…and THAT really is THE story right now. The market is already smoking hot for spring and the economic risks such as rising interest rates and the falling stock market have not derailed that American homebuyer yet.
Here’s the data:
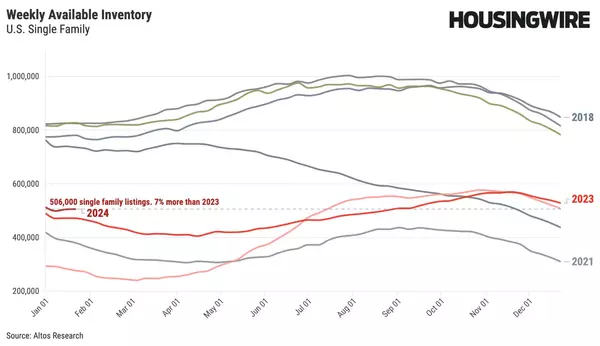
Available inventory of homes for sale…fell… again, this week and there are only 255,976 single-family homes available as of today. There will be another 80,000+ listed in the coming week and many of those will not last a full week on the market.
As we’ve been saying for the last several weeks, there really isn’t anything on the horizon that is slowing that insatiable demand. If we go back to 2018, rising interest rates definitely caused the market to slow. Another factor to consider is that for the last decade…, each year, about 7% of the inventory has been removed from the market and converted into investment properties. However, in February 2019, as a result of those rising interest rates, we had 6% more inventory, which was a swing of 12-13% in the available inventory…The point we’re making here is: the US Mortgage Market doesn’t really allow for bigger changes than that.
Rising mortgage rates will impact our decisions to buy another investment property or a 2nd home, and the homeowners that have locked in mortgage 30-year interest rates are still gaining equity each year. Because homeowners are in such good equity positions, we don’t expect a wave of delinquencies or foreclosures on the horizon.
Buyers may shift their affordability window a bit, however, they are still going to buy their house.
Prices:
The price of the new listings is one of the indicators we’ve been watching…this week the price of the new listings is spiking and is at $375,000, which is the same as the Median Price of all Listings. That in itself is noteworthy in that there is usually a gap between these two numbers at this point in February. We usually don’t see this until late March, telling us that the market is really bullish presently.
Immediate Sales:
We had a little bit of a dip in the total volume this week and of the nearly 60,000 new listings, 31% went under contract within hours or days…this is again telling us the market is not falling or slowing down. This area is where we actually think a decrease in these numbers would be healthy for the market, however, we’ll watch and see.
Price Reductions:
Price reductions were down to 19.2% of the inventory which is less than last week’s 19.5% and is fewer than last year’s number at this time. This supports the other factors that we’re watching and begins to connect all the dots on the state of the housing market today.
Let’s Get Local!
- Castro Valley: This week the median list price for Castro Valley, CA is $1,249,000 with the market action index hovering around 94. This is about the same as last month’s market action index of 92. Inventory is currently at 11. Median Days on Market is at 0. In the last few weeks, the market has achieved a relative stasis point in terms of sales to inventory. However, inventory is sufficiently low to keep us in the Seller’s Market. If the market heats up, prices are likely to resume an upward climb. San Lorenzo: This week the median list price for San Lorenzo, CA is $889,500 with the market action index hovering around 96. This is less than last month’s market action index of 99. Inventory has held steady at 2 and median Days on Market is 7. The market has achieved a relative stasis point in terms of sales to inventory and prices have been went up last week. Since we’re in a Seller’s Market, watch for changes in Market Action Index. If the MAI resumes its climb, prices will likely follow suit. If the MAI drops consistently or falls into the Buyer’s zone, watch for downward pressure on prices.
- San Leandro: This week the median list price for San Leandro, CA is $799,000 with the market action index hovering around 91. This is less than last month’s market action index of 93. Inventory has increased to 22. Median Days on Market remains at 0 (Average Days on Market is 8). The market has started cooling and prices have been flat for several weeks. Since we’re in a Seller’s Market, watch for changes in Market Action Index. If the MAI resumes its climb, prices will likely follow suit. If the MAI drops consistently or falls into the Buyer’s zone, watch for downward pressure on prices.
- Hayward: This week the median list price for Hayward, CA is $849,950 with the market action index hovering around 87. This is less than last month’s market action index of 87. Inventory has fallen to 19. Median Days on Market is 7. The market remains in a relative stasis in terms of sales to inventory. Prices have not been moving higher for several weeks. However, inventory is sufficiently low to keep us in the Seller’s Market zone so watch changes in the MAI. If the market heats up persistently, prices are likely to resume an upward climb.
- Danville: This week the median list price for Danville, CA is $2,718,000 with the market action index hovering around 79. This is less than last month’s market action index of 80. Inventory has increased to 19. Median Days on Market is at 7. The market has been cooling over time and prices have recently flattened. Despite the consistent decrease in the MAI we’re still in a Seller’s Market, where significant demand leaves little inventory available. If the MAI begins to climb, prices will likely follow suit. If the MAI drops consistently or falls in the Buyer’s Zone, watch for downward pressure on prices.
When considering a move, reach out to us and discover the best buying and selling strategy for your neighborhood and community. See the price trends for your area and how long homes have been on the market. and earn how interest rates may impact your sale and purchase.
Knowing these specific behaviors for your community will result in maximizing the equity you have worked hard for over the span of your homeownership.
Crystal and I are passionate about helping you prosper while we help you achieve your real estate goals and we would love the opportunity to help.
Bye for now and thank you for reading along with us.
Warmly, Dean
Dean & Crystal Souza
Realtor | Broker Associate
Century 21 RE Alliance – Souza Team
homes@souzateam.com
510-881-1761
DRE 00967442 | 01448392
Focused on the Success of Your Move
This is not intended to solicit properties or persons under contract.